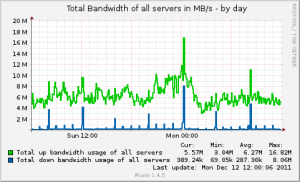
If you are addicted to graphs, like me, you will like this one. You will be able to generate the following graph:
It combines the bandwidth statistics of the given servers, and creates a awesome graph for it.
Put the following code below your host-tree:
Text |copy code |?
1 2 3 4 5
Replace [server1] – [server4] with your server names, use the server names that you used in your host tree.
Basically it generate 2 lines, upload and download, and uses the “sum” function to get the total of all servers combined,


surprisingly